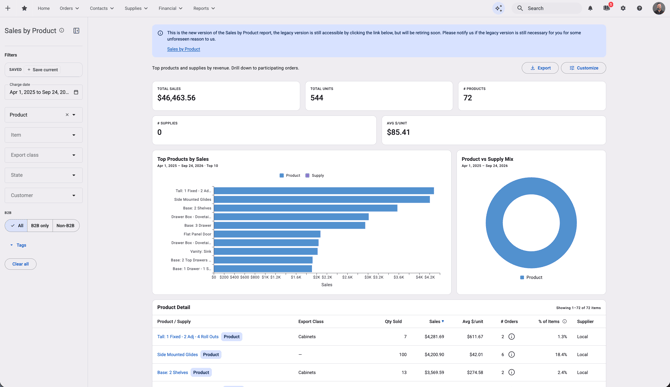
Your reports have a new look, with charts, summary tiles, and more filters. You decide what shows up and in what order, so the numbers you care about are right where you expect them.
In this article- What's new in your reports
- Customize a report
- Show or hide columns, charts, and tiles
- Reorder columns and sections
- Restore the default layout
- Save the filters you use most
- Export your customized report
- Find the previous version of a report
What's new in your reports
If a report looks different the first time you open it, that's totally normal. Most of your reports now have a fresh layout that makes it easier to spot trends and get to the answer you need, and the rest are on their way. Depending on the report, you'll see:
- Charts that show trends at a glance
- Summary tiles with key totals and visuals across the top
- More filters to narrow the report down to exactly what you're looking for
- Columns you control, so you can show only what matters to you and put them in your order
The best part is that none of this is locked in. If you'd rather skip the charts or only see a handful of columns, you can set the report up that way, and it'll stay that way for you (and you can also reset to the default view any time if you no longer want your changes saved).
Customize a report
Everyone uses reports a little differently. Your production manager might live in one set of columns while your office manager needs another. Customizing lets each person set up a report for how they actually work.
- Open the report you want to customize.
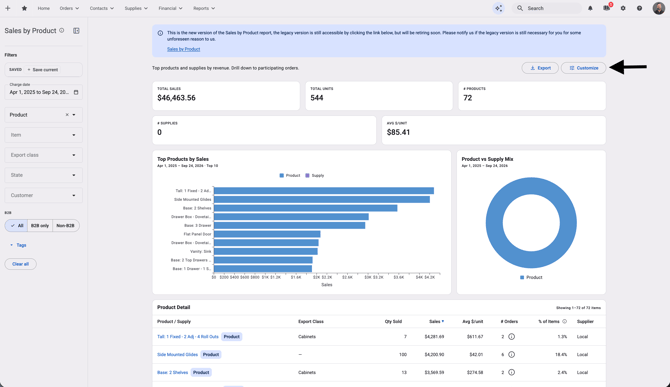
- Click Customize at the top right of the page, next to Export.
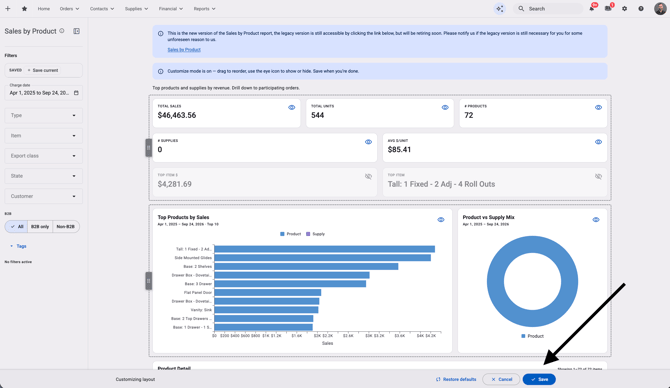
- The report switches into customize mode, and a bar appears at the bottom of the screen.
- Show, hide, and reorder what's on the page (more on that below).
- When you're happy with it, click Save in the bar at the bottom. Changed your mind? Click Cancel to leave without saving.
Your layout is saved just for you, on that report. Changing how a report looks won't change it for anyone else on your team, and it won't change your other reports. Anyone who has access to a report can customize it.
Show or hide columns, charts, and tiles
A report is easier to read when it only shows what you need. If a chart isn't useful to you, or a column is just noise, hide it.
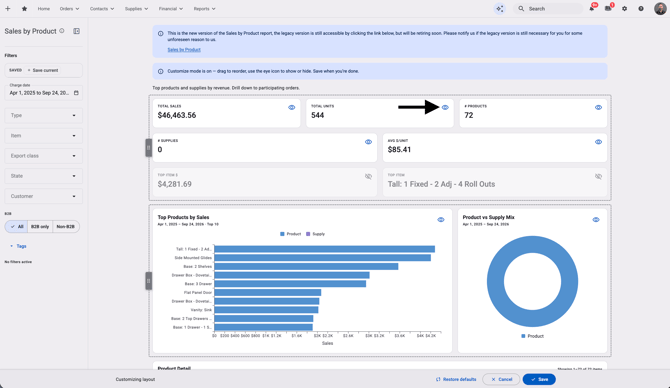
In customize mode, click the eye icon on any column, chart, or summary tile to show or hide it. Each one works on its own, so you can keep the tiles you check every day and hide the rest. Hidden items aren't gone. You can bring them back the same way anytime.
Reorder columns and sections
Put the information you check first where your eyes land first. If you always look at totals before anything else, move them up.
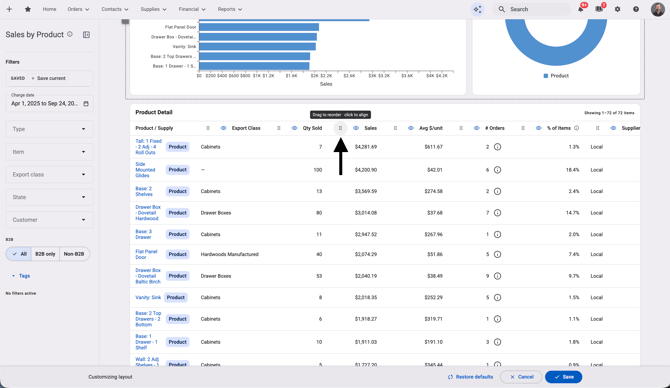
In customize mode, use the drag handle on a column or section and drag it to where you want it. Don't forget to click Save when you're done.
Restore the default layout
Go ahead and experiment. Nothing you change is permanent, and if a report ends up looking a little messy, you can start fresh.
In customize mode, click Restore defaults in the bar at the bottom of the screen. The report goes back to its original layout, with every column, chart, and tile showing in its default order.
Save the filters you use most
If you run the same report with the same filters every week, save them as a search so you don't have to set them up each time.
- Set the filters you want in the sidebar on the left.
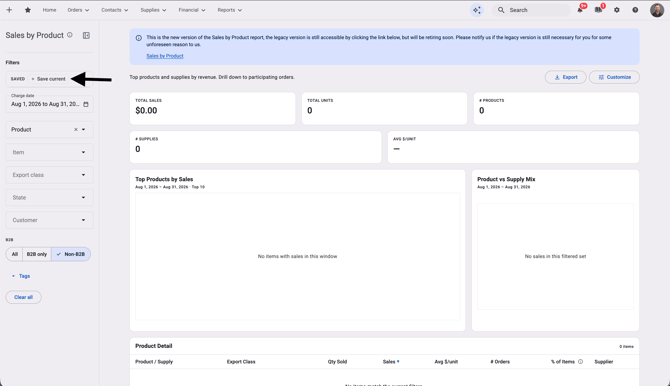
- At the top of the sidebar, click + Save current.
- In the Save this search window, give your search a name you'll recognize, like "Last 30 days" or "Open invoices."
- Choose how the Date range should work:
- Relative keeps moving with the calendar. For example, "last 30 days" will always show the most recent 30 days, whenever you open it.
- Exact dates always shows results for the specific dates you picked.
- Click Save search.
Your saved search shows up as a pill next to SAVED at the top of the sidebar. Click it anytime to apply those filters again. Like your layout, saved searches are just for you and just for that report.
Export your customized report
When you click Export, you get the report the way you've set it up. Hidden columns stay out and your column order carries over, so the file matches what you see on screen.
Find the previous version of a report
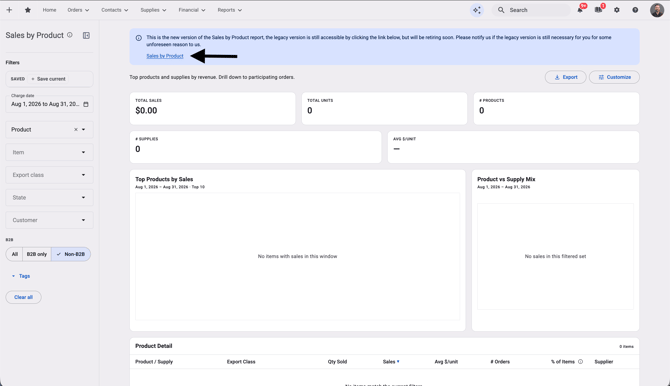
If you need the previous version of a report, you'll find a link to it in the blue banner at the top of the page.
If there's something you can only do in the previous version, we'd really like to hear about it. Let us know which report and what you need, and we'll take it back to our developers so we can bring it into the new reports.